


- Room 1807, Unit 9, Building 2, Shangxing Commercial Street, Shangde Road, Shangxing Community, Xinqiao Subdistrict, Bao'an District, Shenzhen City, China
CONTACT US

WhatsApp

Contact Us
Our team is on stand by, waiting toassist you.
Videos
A large collection of educational videos and tutorials.
About Us
Learn about our company, leadership, and mission totransform manufacturing.
Privacy Policy
Applies to all personal information collected through and/or processed in connection.

Aerospace & UAV
WJ Prototypes is your 3D manufacturing partner from prototype to large scale production.
Consumer Electronics
New Product Introduction Solutions for Consumer Electronics.

Robotics & Automation
Need some assistance bringing your robotic device or parts from the sketch-board to reality?
Medical Devices
The medical industry needs high quality, dependable and safe parts and products.
Automotive
New Product Introduction Solutions for Automotive
Industrial Machinery
The main purpose of industrial prototyping is to take the product from drawings into the real world.


TL;DR:
Manufacturing lead time includes the entire process from order receipt to product shipment, covering both active processing and wait times. Queue and wait time often account for 50-70% of total lead time, significantly impacting schedules, especially if unmeasured or unmanaged. Controlling WIP, reducing changeover times with SMED, and using finite capacity scheduling effectively shorten lead times and improve production predictability.
Manufacturing lead time is one of the most misunderstood metrics in production planning. Many professionals treat it as synonymous with production time or cycle time, then wonder why their schedules slip. What is manufacturing lead time, really? It spans the entire journey from the moment an order is received to the moment the finished product ships, covering procurement, queuing, setup, production, inspection, and delivery. Getting this definition right is the foundation of every scheduling decision you make.
| Point | Details |
|---|---|
| Lead time is not cycle time | Manufacturing lead time covers order receipt to delivery, while cycle time only measures active processing. |
| Queue time dominates timelines | Wait time between operations accounts for 50-70% of total lead time, dwarfing actual run time. |
| Planning accuracy drives reliability | Over-reliance on estimated rather than actual shop-floor data causes chronic scheduling failures. |
| SMED and WIP control cut lead time fastest | Reducing setup times and controlling work-in-progress levels create the largest, fastest reductions. |
| Process selection shapes your baseline | Choosing a manufacturing process without comparing lead time benchmarks risks schedule delays before production even starts. |
Manufacturing lead time covers the total duration from order initiation through final delivery, including every value-added and non-value-added activity along the way. That last part is what most planners underestimate. Here is how the full timeline breaks down:
The part that consistently surprises practitioners is queue time. Queue time often represents 50-70% of total manufacturing lead time, far exceeding actual machine run times. Your parts may be on a machine for two hours, but they waited two days to get there.
| Lead time component | Typical share of total lead time |
|---|---|
| Material procurement | 15-25% |
| Queue and wait time | 50-70% |
| Setup and changeover | 5-10% |
| Active run time | 5-15% |
| Inspection and shipping | 5-10% |
This is why lead time efficiency, calculated as setup time plus run time divided by total lead time, typically sits below 15%. You are spending more time waiting than working.
Lead time vs. cycle time vs. throughput time. Cycle time measures how long one unit takes to move through a single process step. Throughput time captures the duration from raw material entry to finished goods at the end of the production line. Manufacturing lead time wraps both of those inside a larger envelope that includes procurement and shipping. Confusing these three metrics leads to production plans built on the wrong numbers.
Pro Tip: When your schedule keeps missing by the same margin every cycle, the culprit is almost always unmeasured queue time. Map your shop floor with actual timestamps, not estimates, and the gap will become obvious within one week.
Understanding what extends lead time puts you in a position to control it. The factors are predictable, even if the interactions between them are not.
Planning accuracy and capacity data. Approximately 1 in 3 orders in custom manufacturing environments ship late because planning does not reflect true production capacity. Schedulers accept estimates from industrial engineers rather than pulling actual timestamps from the shop floor. The result is a schedule that looks achievable on paper and fails in practice.
Work-in-progress congestion. High WIP levels create queues at every bottleneck. When you release too many orders to the floor simultaneously, each order spends more time waiting than it does being processed. This is a well-documented but chronically underaddressed cause of lead time inflation. Lean tools like Value Stream Mapping reveal that the majority of total lead time is non-value-added activity, most of it invisible to managers who never walk the floor with a stopwatch.

Setup and changeover time. Long changeovers force manufacturers to run large batches to justify the setup cost. Large batches mean longer queue times and delayed starts for other jobs. This creates a vicious cycle where the attempt to be efficient actually extends total lead time.
Supply chain variability. External dependencies are some of the hardest lead time factors to control. Supplier delays, minimum order quantities that require waiting to consolidate shipments, and long-lead specialty materials all add time that your internal schedule cannot absorb. Decision latency, the gap between when you receive information about a shortage or delay and when you act on it, compounds these external delays into emergency purchases and production stoppages.
"Decision latency caused by delayed visibility into material shortages or lead time shifts results in emergency purchases and production disruptions. Real-time software integration is critical to reducing these hidden costs."
Pro Tip: Before investing in new equipment, audit your changeover logs for the last 90 days. In most facilities, a 30% reduction in average setup time is achievable with existing equipment through better tooling organization and standardized procedures alone.
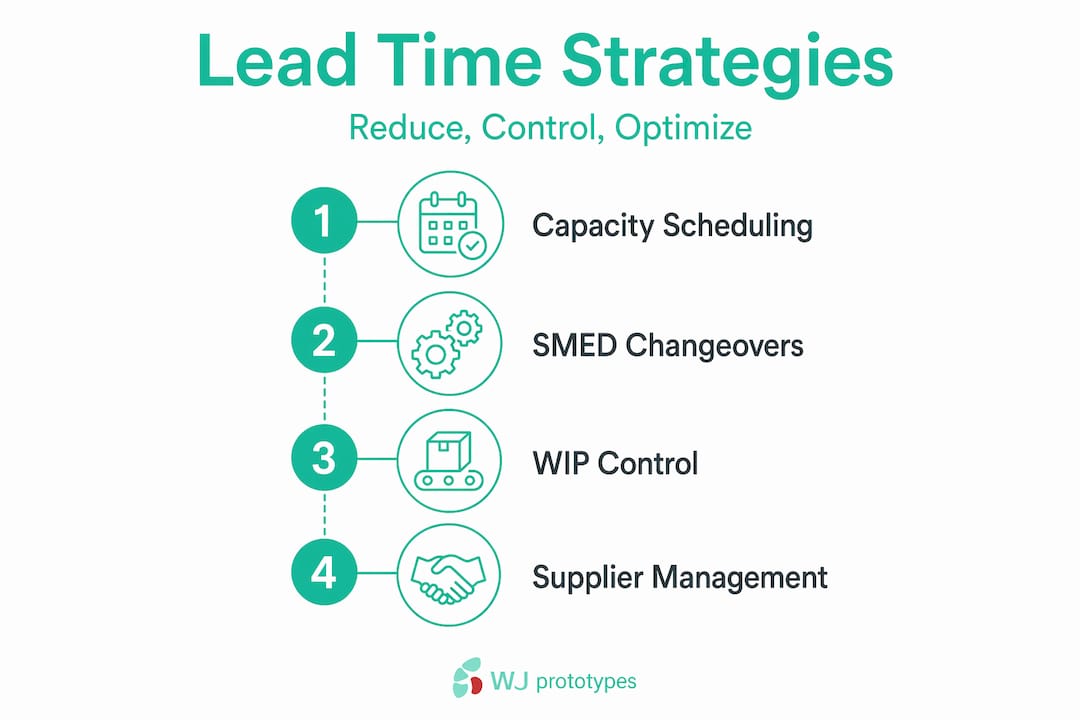
Knowing what inflates lead time is half the battle. Here are the methodologies that actually move the needle, along with an honest look at their tradeoffs.
Finite capacity scheduling. Most ERP and MRP systems use infinite capacity models that ignore real work center constraints, which causes workload pile-ups and extended lead times. Finite capacity scheduling accounts for actual resource availability and prevents queue formation before it happens. The result is that finite capacity scheduling can reduce average lead times by 15-25%.
SMED (Single Minute Exchange of Die). This structured approach to reducing changeover times focuses on converting internal setup steps (done while the machine is stopped) to external steps (done while the machine runs). Reducing setup and changeover times by 40-60% via SMED allows you to justify smaller batch sizes, which directly cuts queue time for every other job on the floor.
WIP control and work release discipline. The single most effective lever for reducing queue time is controlling how much work you release to the floor at once. Pull-based release systems tied to downstream capacity prevent pileups at bottlenecks. Reducing lead time is more effectively achieved through WIP management than by increasing machine speed or running overtime, both of which often worsen flow.
Supplier management and component commonality. Rationalizing your supplier base to trusted, fast-turnaround vendors reduces procurement lead time. Designing products with common components across variants reduces the number of unique items requiring separate procurement cycles.
| Strategy | Lead time impact | Key tradeoff |
|---|---|---|
| Finite capacity scheduling | 15-25% reduction | Requires accurate capacity data to be effective |
| SMED changeover reduction | 40-60% setup reduction, smaller batches | Needs operator training and management commitment |
| WIP and work release control | Largest queue time reduction | Requires discipline to not over-release during pressure |
| Real-time data integration | Cuts decision latency significantly | Software investment and change management required |
| Supplier consolidation | Shorter, more reliable procurement | Reduces supply chain redundancy |
Pro Tip: When rolling out finite capacity scheduling, start with your top three bottleneck work centers rather than the entire floor. A targeted rollout builds trust in the system faster and delivers visible results within the first month.
Before you optimize an existing process, you need to know whether you have chosen the right process in the first place. Engineers often choose manufacturing processes based on familiarity rather than lead time and cost efficiency, which creates delays that no scheduling improvement can fix.
Here is what to evaluate when comparing process options against your project timeline:
Choosing manufacturing processes without comparing lead time and cost benchmarks for representative parts leads directly to schedule delays. The decision should be made with your project milestone chart open, not after the fact.
For a useful side-by-side view across factory types, the prototyping factory comparison at Wjprototypes breaks down cost and lead time by service category, which helps project managers set realistic timelines before committing to a supplier.
I have reviewed dozens of production operations where the stated goal was lead time reduction, and the pattern is almost always the same. The team knows lead time is too long. They invest in faster machines or push for overtime. Neither works, at least not for long. What actually works is unglamorous: controlling the queue.
The uncomfortable truth I have arrived at is that most facilities are not slow at making parts. They are slow at getting parts started. Work sits in queues because schedulers release too much work, because WIP accumulates, and because the planning system assumes infinite capacity where none exists. Relying on estimated times instead of actual shop-floor data leads to chronic schedule inaccuracies that no amount of expediting will fix.
The second lesson that took me time to internalize: cross-functional visibility matters more than any single scheduling methodology. When procurement, production, and quality each operate with different datasets and different update frequencies, decision latency fills the gaps between them. Integrated real-time data does not just speed up reaction times. It eliminates entire categories of firefighting. I have seen facilities cut firefighting labor by 40% simply by giving the scheduling team access to live inventory and supplier data.
The resistance to change in these projects is real and should not be underestimated. Operators distrust systems that tell them to slow down releasing work. Managers worry that idle machines signal wasted capacity. Working through that resistance takes more time than the technical implementation. But the facilities that sustain lead time gains are always the ones that got the cultural alignment right, not just the software configuration.
— Nas
When your project schedule depends on hitting specific delivery windows, your manufacturing partner's reliability matters as much as your internal scheduling discipline. WJ Prototypes offers CNC machining, vacuum casting, and die casting services from China with globally competitive turnaround times and transparent lead time communication from quote to delivery.
For prototype and low-volume production work, the CNC machining services at WJ Prototypes cover a broad range of metals and engineering plastics, with typical lead times of 3-7 business days for standard complexity parts. The CNC machining materials page details material-specific lead time considerations so you can plan accurately before placing an order.
For teams evaluating casting options, vacuum casting services at WJ Prototypes deliver low-volume runs of production-quality parts within competitive lead times that work for product development cycles. Request an instant quote directly on the site to get a real delivery date aligned with your project milestones.
Explore Competitive Custom Manufacturing Services With Expert Support From WJ Prototypes.
Whether you're comparing suppliers or looking to optimize costs, our team can help you evaluate the best option for your project.
👉 Request A Quote now or email us at info@wjprototypes.com to get started.
Manufacturing lead time is the total time from when an order is placed to when the finished product is delivered, including procurement, production, quality inspection, and shipping. It encompasses both value-added production time and non-value-added wait time.
Cycle time measures how long a single unit spends being actively processed at one operation. Manufacturing lead time is the broader total duration that includes queue time, procurement, and shipping on top of all cycle times combined.
Queue and wait time between operations typically account for 50-70% of total manufacturing lead time, far exceeding actual machine run time. Reducing queue time through WIP control delivers the largest lead time gains.
Lead time in production is calculated by adding all component durations: procurement time plus queue time plus setup time plus run time plus inspection time plus shipping time. Lead time efficiency equals setup plus run time divided by total lead time, and typically runs below 15%.
The fastest documented reductions come from combining WIP and work release control with SMED-based changeover reduction. Finite capacity scheduling adds a further 15-25% reduction by preventing queue formation before it starts.
How UK Manufacturers Reduce Lead Times with Chinese Rapid Prototyping
Low-volume Manufacturing: 3 Proven Examples
Online Manufacturing Vs. Direct Factory: True Cost In 2026
CNC Machining Lead Time in China - Shipping Options & Delivery Time
Explore Competitive Custom Manufacturing Services With Expert Support From WJ Prototypes.
Whether you're comparing suppliers or looking to optimize costs, our team can help you evaluate the best option for your project.
👉 Request A Quote now or email us at info@wjprototypes.com to get started.
SERVICES
RESOURCES


